
I wrote about RAISEonline in March this year, and this has consistently been the most read post on Icing on the Cake. This is despite it being a long, detailed argument against RAISEonline, which contained – the horror! – equations, explanations of statistical theory and ideas which most readers found challenging.
So I’m going to write about RAISEonline again. I’m going to show that its entire foundation is based on number crunching which has been rejected by statisticians as too simplistic and, unfortunately, too badly understood to be used by non-experts. And when I meet Ofsted’s Mike Cladingbowl and Sean Harford later this month to discuss Ofsted’s use of data, I’m going to ask them to review the way which Inspectors and Governors use RAISEonline to hold schools to account. I'm also going to ask those in charge of official government statistics to examine RAISEonline's foundations, and to consider how to reassess the way which data is used to hold schools to account.
Now, part of reason for writing this is to show that both those responsible for and those who use RAISEonline seem to have completely misunderstood the statistics which they are using. That does mean that this post might be a bit challenging. It will require you to think hard. But unless you are prepared to do that, there is no way that you will understand why RAISEonline is so dangerously flawed. Of course, if you do understand the statistics, you'll sail through the arguments I'm about to make. Either way, I urge you to think hard about how we currently use Test Scores and to question what RAISEonline does.
RAISEonline has significant problems
To summarise my earlier argument, RAISEonline, or ‘Reporting and Analysis for Improvement through school Self-Evaluation’ may as well be called Reporting Utter B******* Because It’s Simply Hogwash. I identified a number of problems with it:
I want to turn to the last problem on this list to look closely at what statisticians mean when they say that something is ‘statistically significant’.
As I said in March, “What significance tests do is suggest – and that’s all they do – that one mean which is very different to another may be from a different population and that this is not simply by chance.“ I then left readers to explore further, saying, “There is more to the idea of significance involving Null Hypotheses and Type I and Type II errors.”
I want to look more closely at ‘statistical significance’, then look at the source of RAISEonline’s statistical reasoning, and finally at what working academic statisticians say about this reasoning.
A significance test is just a number crunching exercise
As I said in my earlier post, “Statisticians collect data from a random sample of the population under scrutiny and find its mean, by adding up all the numbers and dividing the total by the number of observations. Then they test it to see if it is different to a mean of another random sample.”
In summary, a significance test result is said to be ‘statistically significant’ at the 95% level if the sample mean is calculated to have is a less than 1 in 20 chance of being drawn from the same population as another sample.
Of course, a significance test is just a number crunching exercise, as those who developed them were at pains to point out. There could be many other reasons why a sample appears to be ‘significant’ according to the test. Amongst these are the Type I and Type II errors I mentioned previously.
In brief, a Type I error is a Type I error is made when something is said to be significant when it isn’t.This often referred to as a 'false positive'. A Type II error is when there is a significance but a test sample is found not to be significant. This is often referred to as a 'false negative'.
Ooooh… Blue… Green…
The official explanation of what RAISEonline does is as follows:
“Significance Tests
Significance is a statistical term that shows if a difference or relationship exists between populations or samples of data. After finding a significant relationship, it is important to evaluate its strength. Significant relationships can be strong or weak. Significant differences can be large or small depending on the sample size.
Significant tests are used in RAISEonline and school Full Reports to determine if a measure for a particular school’s cohort is significantly different from the national cohort. Significance tests are performed on the data using a 95% confidence interval.” (P61)
This is a terrible explanation of a test of statistical significance. The phrase ‘a significant relationship’ will make any statistician hang their head in horror. ‘Significant differences can be large or small depending on the sample size’ is almost entirely meaningless. But it does confirm that RAISEonline uses a 95% significance test. Where it goes really wrong is when it then colours certain items in a RAISEonline report blue or green, like this:
So I’m going to write about RAISEonline again. I’m going to show that its entire foundation is based on number crunching which has been rejected by statisticians as too simplistic and, unfortunately, too badly understood to be used by non-experts. And when I meet Ofsted’s Mike Cladingbowl and Sean Harford later this month to discuss Ofsted’s use of data, I’m going to ask them to review the way which Inspectors and Governors use RAISEonline to hold schools to account. I'm also going to ask those in charge of official government statistics to examine RAISEonline's foundations, and to consider how to reassess the way which data is used to hold schools to account.
Now, part of reason for writing this is to show that both those responsible for and those who use RAISEonline seem to have completely misunderstood the statistics which they are using. That does mean that this post might be a bit challenging. It will require you to think hard. But unless you are prepared to do that, there is no way that you will understand why RAISEonline is so dangerously flawed. Of course, if you do understand the statistics, you'll sail through the arguments I'm about to make. Either way, I urge you to think hard about how we currently use Test Scores and to question what RAISEonline does.
RAISEonline has significant problems
To summarise my earlier argument, RAISEonline, or ‘Reporting and Analysis for Improvement through school Self-Evaluation’ may as well be called Reporting Utter B******* Because It’s Simply Hogwash. I identified a number of problems with it:
- The ‘What’s it testing?’ problem
- The Not Independent and Identically Distributed problem
- The Key Stage 1 Data Manipulation problem
- The Primary Age problem
- The Loss of Definition Problem
- The Missing Data Problem
- The Misunderstanding Significance Problem
I want to turn to the last problem on this list to look closely at what statisticians mean when they say that something is ‘statistically significant’.
As I said in March, “What significance tests do is suggest – and that’s all they do – that one mean which is very different to another may be from a different population and that this is not simply by chance.“ I then left readers to explore further, saying, “There is more to the idea of significance involving Null Hypotheses and Type I and Type II errors.”
I want to look more closely at ‘statistical significance’, then look at the source of RAISEonline’s statistical reasoning, and finally at what working academic statisticians say about this reasoning.
A significance test is just a number crunching exercise
As I said in my earlier post, “Statisticians collect data from a random sample of the population under scrutiny and find its mean, by adding up all the numbers and dividing the total by the number of observations. Then they test it to see if it is different to a mean of another random sample.”
In summary, a significance test result is said to be ‘statistically significant’ at the 95% level if the sample mean is calculated to have is a less than 1 in 20 chance of being drawn from the same population as another sample.
Of course, a significance test is just a number crunching exercise, as those who developed them were at pains to point out. There could be many other reasons why a sample appears to be ‘significant’ according to the test. Amongst these are the Type I and Type II errors I mentioned previously.
In brief, a Type I error is a Type I error is made when something is said to be significant when it isn’t.This often referred to as a 'false positive'. A Type II error is when there is a significance but a test sample is found not to be significant. This is often referred to as a 'false negative'.
Ooooh… Blue… Green…
The official explanation of what RAISEonline does is as follows:
“Significance Tests
Significance is a statistical term that shows if a difference or relationship exists between populations or samples of data. After finding a significant relationship, it is important to evaluate its strength. Significant relationships can be strong or weak. Significant differences can be large or small depending on the sample size.
Significant tests are used in RAISEonline and school Full Reports to determine if a measure for a particular school’s cohort is significantly different from the national cohort. Significance tests are performed on the data using a 95% confidence interval.” (P61)
This is a terrible explanation of a test of statistical significance. The phrase ‘a significant relationship’ will make any statistician hang their head in horror. ‘Significant differences can be large or small depending on the sample size’ is almost entirely meaningless. But it does confirm that RAISEonline uses a 95% significance test. Where it goes really wrong is when it then colours certain items in a RAISEonline report blue or green, like this:
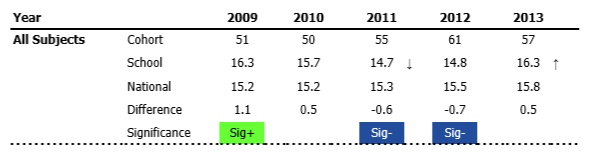
The + and – symbols are powerful. Positive and negative are pretty binary concepts – one good, one bad. Clearly, stating that there something is ‘Sig+’ and ‘Sig-‘ is highly misleading if the impression which is given is that green is good and blue is bad. They are neither. They are merely statistically significant, i.e. not likely to be the result of chance. They are not ‘significantly good’ or ‘significantly bad’.
Remember as well that an item could be marked Sig+ or Sig- but have a Type I error. This would happen if the item was found to be statistically significant at the 95% level, but that this was not actually justified. Maybe the item included data which was wrong, or contained an extreme outlier. Maybe half the class was ill on the day a test was taken, or their teacher had been off school for some reason, or Ofsted turned up the week before and sent everyone into a tail spin. Either way, it could be as a result of a Type I error.
On the other hand, a number not coloured in could have a Type II error. The test should have found it to be significantly different at the 95% level, but didn’t for some reason. Maybe a high flying child was off school for the test, or a marker added up the numbers of marks incorrectly. Maybe huge numbers of paper were incorrectly marked. A Type II error would result if a statistically significant result was not indicated by the test.
Both types of error are important. But either way, the test doesn’t tell you anything. The colours clearly tell Inspectors and Governors something, however.
What Inspectors and Governors are told to think about colour
This is from widely respected Ofsted Inspector Mary Myatt’s blog Making Sense of RAISEonline, and demonstrates the kind of misleading advice which Ofsted Inspectors have been given.
“Figures highlighted in blue mean that students are performing significantly below other students nationally
Those in green mean they are significantly above national.”
This is completely wrong. The colours don't 'mean' that at all. They simply indicate that the result is 'statistically significant' - nothing more and probably less. A large number of the students might be being tutored at home. A large number might never read for pleasure. A group of SATs papers might have been incorrectly marked. A majority of the students might have parents educated to degree level. Maybe they are, on average, four months older than most children in their national cohort. A significance test using Test Scores can't tell you 'how the children are performing', only that the numbers are 'statistically significant', which isn't the same thing at all.
Governors are routinely misadvised too. The National Governors’ Association’s Knowing Your School says the following:
“Each school figure is compared with that year’s national result, the difference is shown and a statistical test has been carried out to indicate if the schools result is below (blue) or above (green) the national result.”
It’s hard to overstate just how wrong this is. Significance testing can be wrong, either because the number crunching suggests that there is something different about the sample when there is not, or because a sample may not be flagged as different when it should be. Even by the standards of basic significance, Ofsted inspectors and Governors have been badly advised and are clearly using tools which they simply do not understand.
And even if Inspectors and others say that RAISEonline is merely a signpost and not a destination, if the signs are colourfully highlighted and clearly wrong, then surely it's much more likely you'll end up at the wrong destination?
Further issues with RAISEonline
Having looked closely at the statistics underpinning RAISEonline, I notice that two different tests of significance are used. So I asked the team at RAISEonline about them.
I asked, “On page 14 of the guide, a formula is given for calculating significance. This suggests that a Z-test is being used to test for significance, as a Z-score is tested against a figure of 1.96. On page 25-26, a t-test is used to test for significance. Could you explain why the two different tests have been used?”
In brief, Z-tests are used for numbers greater than 30 and t-tests are used for small samples.
The response from RAISEonline was very interesting. It is quite long winded, and a bit contradictory, so I’ve put it here. In essence it says:
"‘Average Point Scores at Key Stage 2’ is tested against a population standard deviation, which is ‘known’, using a Z-test.
‘Average Points Score at Key Stage 4’ against a population standard deviation, which is ‘known’, using a t-test.
School level APS values are assumed to be based on more than 30 observations and should use Z-tests, and pupil group APS values are assumed to be based on less than 30 observations and should use t-tests.
But ‘This is not a practical solution and would add a layer of complexity that can be avoided by applying a single methodology.’"
It sums up what the powers that be have decided they can do with the data:
“Statisticians within Ofsted and the Department for Education decided to accept simplifying assumptions and apply a t-test to APS significance tests. This has three major benefits:
1. Applying the same formula throughout APS significance tests makes the methodology more accessible to users and avoids concerns about applying different statistical tests to the same metric within the same school.
2. Using a t-test is more robust than a Z-score for small cohorts (as it is less sensitive to outliers), but converges on the results of a Z-test as the sample size increases; applying a t-test to all cohorts provides robust outcomes whilst not being overly-sensitive to larger sample sizes.
3. The t-test is a more conservative test than using a Z-test and as such, it reduces the probability of making a type I error. A type I error occurs when the difference is said to be significant when it is not significant. This in turn increases the probability of making a type II error, i.e. stating that the difference is not significant, when perhaps it is significant. The impact of a type I error is judged to be greater than the impact of a type II error in this situation.”
I’ll let you read that again. It probably still doesn’t make much sense. As far as I can gather, this says that, even though the Methodology document clearly uses two different tests, government statisticians have decided to apply t-tests to all cohorts. They have also decided that Type I errors are more important than Type II errors.
This arbitrary messing around with statistical theory is a little baffling. The people who developed Z-test and t-tests were at pains to explain the important assumptions they were making, and to make it clear the limitations of their models. They recognised the possibility of two types of errors. As I said previously, RAISEonline seems to have completely ignored the basic assumptions which have to be in place for you to be able to make inferences from significance testing. Simply messing around with their carefully developed tests seems a little, well, cavalier.
But the RAISEonline team really raised my hackles when they included this in their email:
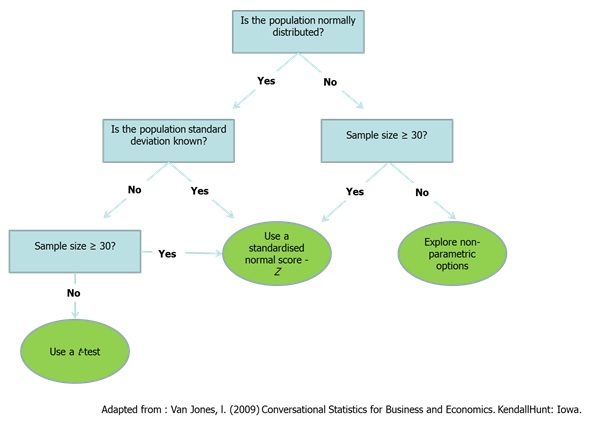
That little citation at the bottom leads to ‘Conversational Statistics for Business and Economics’ by L Van Jones. Here’s a biography of Mr Van Jones. Here’s his home page at the Texas Christian University. His degree was in ‘Commerce’ in 1961. He is a businessman teaching elementary statistics in the context of business. He’s not a statistician, and he’s not exactly an expert in the field.
I’m not sure that I think that Mr Van Jones represents the best that has been thought and said about statistical inferences. It turns out that he isn’t. In fact, he is a long way from the current thinking about tests of significance. A very long way indeed.
Statisticians know that simple tests of statistical significance are not well used, and suggest that we don’t use them
Andrew Gelman is a Professor of Statistics and political science and director of the Applied Statistics Center at Columbia University, an Ivy League institution which administers the Pulitzer Prize. Hal Stern is Professor of Statistics at University of California, Irvine, which is ranked 1st among all US universities and 5th among the top 100 global universities under 50 years old. If you want an argument from authority, they are go-to guys.
In 2006, they published a fairly detailed paper titled, ‘The Difference Between “Significant” and “Not Significant” is not Itself Statistically Significant’. The paper is fairly high level stuff, but it contains the best summary I could find of the current view within the world of academic statistics of the use of simple tests of statistical significance:
“Many of the pitfalls of relying on declarations of statistical significance appear to be well known. For example, by now practically all introductory texts point out that statistical significance does not equal practical importance. If the estimated effect of a drug is to decrease blood pressure by 0.10 with a standard error of 0.03, this would be statistically significant but probably not important in practice. Conversely, an estimated effect of 10 with a standard error of 10 would not be statistically significant, but it has the possibility of being important in practice. As well, introductory courses regularly warn students about the perils of strict adherence to a particular threshold such as the 5% significance level.”
Andrew Gelman runs an excellent blog, which contains the following observation:
“I’m thinking more and more that we have to get rid of statistical significance, 95% intervals, and all the rest, and just come to a more fundamental acceptance of uncertainty.”
It’s worth noting that, in the extract from the report above, estimated effects are reported with ‘standard errors’. This is because statistics deals, at its heart, with uncertainty. Measuring anything introduces error, and it can’t simply be ignored in the way that simplistic mechanistic rubbish like RAISEonline does. And leading statisticians suggest that we should, ‘get rid of statistical significance, 95% intervals, and all the rest’ which means that they would dismiss the entire underpinning of RAISEonline and its simplistic, wrongly interpreted Sig+ and Sig- indicators.
There is much more to be said about the problems with the use of statistical significance testing. Both this blog - On the hazards of significance testing. Part 1: the screening problem - and the follow up to it - Part 2: the false discovery rate, or how not to make a fool of yourself with P values - will give you a small insight into the kinds of problems which arise all too frequently. False positives abound, the kind of which see many schools damned or lauded when an Ofsted inspector - typically untrained in basic statistics and relying on RAISEonline's 'insight' - turns up and makes judgements based on 'data'.
A further set of nails in RAISEonline’s coffin
It is also worth noting a few other serious flaws in RAISEonline.
1) Test Results for a given school should be treated as clustered results rather than a samples from a population. RAISEonline does not account for the fact that two students from a children school are more likely to be similar (in terms of outcomes) than two children sampled from different schools.
2) Test Scores are population data, not sampled data. This is, once again, a bit technical, but in essence sampled data is used to estimate unknown population values. But we know the population values for Test Results, so using sampling theory - as RAISEonline does - makes no sense whatsoever.
3) Test Scores are not reliable enough to be used for statistical analysis. I’ve written about this here.
4) There is no accounting for errors of measurement within RAISEonline. And the errors are huge.
'Serious Doubts About School Effectiveness', an excellent academic paper on the problems with Test Scores written by Professor Stephen Gorard, is worth reading in its entirety. A few highlights are included below. SE is school effectiveness, p-values are the basis for t-tests and Z-tests, NPD/PLASC is the National Pupil Database and its predecessor and DCSF is the predecessor to the Department of Education.
“Even used as intended, p-values cannot help most analysts in the SE field. The same applies to standard errors and confidence intervals and their variants. But the situation is worse than this because in the field of school effectiveness, these statistical techniques based on sampling theory are hardly ever used as intended. Most commonly, the sampling techniques are used with population figures such as NPD/PLASC. In this context, the techniques mean nothing. There is no sampling variation to estimate when working with population data (whether for a nation, region, education authority, school, year, class or social group). There are missing cases and values and there is measurement error. But these are not generated by random sampling and so sampling theory cannot estimate them, adjust for them or help us decide how substantial they are in relation to our manifest data.
Despite all this, DCSF use and attempt to defend the use of confidence intervals with their population CVA data. A confidence interval, remember, is an estimate of the range of values that would be generated by repeated random sampling, assuming for calculation purposes that our manifest score is the correct one. It has no relevance at all to population data like PLASC/NPD.”
“Teachers are spending their time looking at things like departmental VA figures and distorting their attention to focus on particular areas or types of pupils. School effectiveness results have been used to determine funding allocations and to threaten schools with closure (Bald, 2006; Mansell, 2006). The national school inspection system in England, run by OFSTED, starts with a CVA and the results of that analysis partly pre-determine the results of the inspection (Gorard, 2008c). Schools are paying public funds to external bodies for VA analyses and breakdowns of their effective- ness data. Parents and pupils are being encouraged to use school effectiveness evidence (in league tables, for example) to judge their schools and potential schools. If, as I would argue, the results are largely spurious this means a lot of time and money is wasted and, more importantly, pupils’ education is being needlessly endangered.”
“However, the dangers of school effectiveness are even greater than this. School effectiveness is associated with a narrow understanding of what education is for. It encourages, unwittingly, an emphasis on assessment and test scores—and teaching to the test—because over time we tend to get the system we measure for and so privilege. Further, rather than opening information about schools to a wider public, the complexity of CVA and similar models excludes and so disempowers most people. These are the people who pay tax for, work in or send their children to schools. Even academics are largely excluded from understanding and so criticising school effective- ness work (Normand, 2008). Relevant academic work is often peer-reviewed and ‘quality’ checked by a relatively small clique. School effectiveness then tends to monopolise political expertise on schools and public discussion of education, even though most policy-makers, official bodies like OFSTED, and the public simply have to take the results on trust.”
“The whole school effectiveness model, as currently imagined, should be abandoned. It clearly does not, and could not, work as intended, so it causes all of the damage and danger described above for no good reason. It continues partly as a kind of Voodoo science (Park, 2000), wherein adherents prefer to claim they are dealing with random events, making it easier to explain away the uncertainty and unpredictability of their results.”
As I say, I strongly recommend the whole paper. It is a clear and devastating eviseration of the whole 'School Effectiveness' nonsense underpinning RAISEonline.
So what should we do about this?
Well, someone somewhere in government should be interested in the criticisms I’ve made here. I’m meeting people from Ofsted later this month to discuss their use of data. I’ll raise this with them then. Additionally, the government has recently appointed a new Chief Executive of the UK Statistics Authority.
John Pullinger has had a long career as a government statistician, and clearly knows what he is talking about. Additionally, he’s indicated that he might be aware of issues in education, saying of school league tables, “We’re seeing the numbers but are we necessarily drawing the right conclusion? League tables are altering the way schools behave — which children are going to be entered for exams and the way parents behave, which school they’re going to send their child to.”
So I’ve written the following letter to him.
An open letter to John Pullinger
Dear Mr Pullinger,
I am a teacher and parent and I am extremely concerned about the use of children’s Test Scores within RAISEonline, the main dataset used to measure the effectiveness of schools in England. I have written extensively on the flawed foundations on which RAISEonline is built, and I urge you to read the criticisms I have made on my weblog.
My initial suggestions for questions you should ask of the RAISEonline team are as follows:
1) Why is sampling theory used to test population data?
2) How do you respond to Stephen Gorard's paper, Serious Doubts About School Effectiveness?
3) How can you improve what you do with data so that those who use do not come to simplistic and incorrect conclusions about schools based on unreliable Test Scores?
I look forward to hearing from you,
Jack Marwood
Don't bring me problems, bring me solutions
The problems:
RAISEonline's entire foundation is based on number crunching which has been rejected by statisticians as too simplistic and too badly understood to be used by non-experts.
Ofsted Inspectors are not trained sufficiently well to understand the limitations of the data they use.
Governors are badly advised about the statistics in RAISEonline.
Academics have explored the inherent problems of the School Effectiveness model RAISEonline represents.
The solutions:
As a profession, we need to debate the use of Test Score 'data'.
We have a new Chief Executive of the UK Statistics Authority who may be able to help.
Ofsted are beginning to listen to criticisms of RAISEonline and the use of Test Score 'data'.
Those in education should find out more about the ways in which numbers are crunched, and investigate the criticisms of the number crunching.
A few final notes
Thanks for reading this far - I know that this is a long post and I appreciate your time.
I'd be interested to know how many teachers have actually seen a RAISEonline report, either as a printed report on in its online form. Please let me know either on Twitter or in the comments below.
Thanks to those who read the early drafts of this - you know who you are!
Here's a short clip which has been playing in my mind since I started this post:
Don't forget that I'm appearing at the Battle of Ideas on Sunday 19th October at the Barbican.
Come along and say hello.
Come along and say hello.
 RSS Feed
