2016 is the first time seven year olds in England have been assessed under a completely new testing regime. The changes are not straightforward. In summary, Key Stage 1 Scaled Scores are:
Scaled scores are confusing
Children in Year 2 sat entirely new written tests in May 2016, under a new system which replaced the previous test regime. There were six papers: two papers each for Mathematics, Reading and Spelling, Punctuation and Grammar (SPAG). The papers can be downloaded here: Maths, Reading, and SPAG. Whilst the SPAG test was officially abandoned following an administrative error, many children sat the paper, and there are some children who will have been given a SPAG score.
As with all written tests, children have recorded raw scores based on the marks they are awarded for each paper. From 1996 to 2015, these raw scores were converted into a ‘level’. Children in Key Stage 1 were graded N (not working at the level of the test), level 1 (below the expected level), level 2 (at the expected level) or Level 3 (above the expected level).*
For scores from 2016, children’s raw scores are not converted into levels, which have officially been abandoned and not replaced. Raw scores are now converted into a ‘scaled score’, centred around a score of 100. Marks on the reading test, for example, were out of 40, and the scaled scores are distributed as per the following table.
- Confusing
- Alarming
- Fuzzy
- Political
Scaled scores are confusing
Children in Year 2 sat entirely new written tests in May 2016, under a new system which replaced the previous test regime. There were six papers: two papers each for Mathematics, Reading and Spelling, Punctuation and Grammar (SPAG). The papers can be downloaded here: Maths, Reading, and SPAG. Whilst the SPAG test was officially abandoned following an administrative error, many children sat the paper, and there are some children who will have been given a SPAG score.
As with all written tests, children have recorded raw scores based on the marks they are awarded for each paper. From 1996 to 2015, these raw scores were converted into a ‘level’. Children in Key Stage 1 were graded N (not working at the level of the test), level 1 (below the expected level), level 2 (at the expected level) or Level 3 (above the expected level).*
For scores from 2016, children’s raw scores are not converted into levels, which have officially been abandoned and not replaced. Raw scores are now converted into a ‘scaled score’, centred around a score of 100. Marks on the reading test, for example, were out of 40, and the scaled scores are distributed as per the following table.
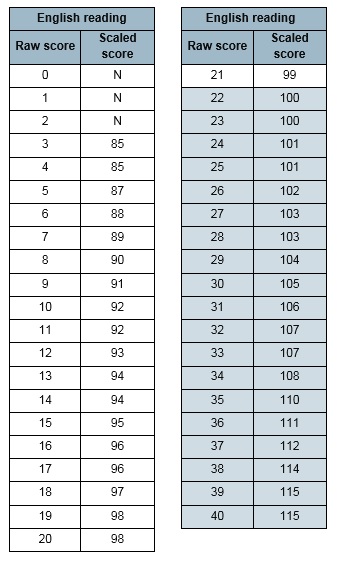
A child who scored 14 raw marks on the Reading test will therefore be awarded a Scaled Score of 94. The way in which raw scores are converted into Scaled Scores is fairly technical, but in essence it requires a human judgement to decide where ‘age related expectations’ are, followed by a mathematical distribution of scaled scores based on the results of a sample of children who trialled the test**. A few more details are here.
Somewhat confusingly for most parents, the Scaled Scores have been selected to give a ‘standardised’ spread of scores between 85 points (the lowest score) up to 115 points (the highest possible score). Those working at the extreme lower end of the current ability scale are awarded N as previously, and those at the top are limited to scoring a maximum of 115 points on the scale.
This standardisation of scores – the technical term for turning a set of data with its own unique distribution into a ‘standard’ distribution – is done so that scores can be compared across different data sets.
In setting the limits for the KS1 test to 15 points around 100, it appears that the Department for Education (DfE) has ensured that roughly 67% of children will have scored between 92.5 points and 107.5 points (although, neither score is possible of course, so this interval is between 12 and 33 marks on the reading test). A further 30% of children have more extreme scores, roughly 15% getting between 85 and 92 (3 to 11 marks) and 15% between 108 and 115 (34 and 38). The final 3% of children have either scored N or 115, those being the ceiling and floor scores for these tests.
Scaled scores are alarming (but need not be)
The move to scaled scores will be alarming for many parents. The idea that their children are labelled with a number near 100 is likely to be very confusing. What does a Scaled Score of 104 or 96 actually mean? Is 104 meaningfully different to 106 or 102? If your child’s best friend is a 98 and your pride and joy is a 102, are they really that different?
The old system of levels, flawed as it undoubtedly was, did give some sense of development, after all, as children generally rose up through the numbers as they progressed through school. What’s more, at the end of KS1 most of the children were working the middle band of Level 2 with a small number working at Level 1 and below and an equally small group working at Level 3.
Since levels were sequential, a child working at one level could reasonably be expected to move to the next level at some point, and the vast majority did exactly that. The problems with levels were legion, and are better explained elsewhere. For all their flaws, however, they did at least give a sense of progression, and were on the whole not likely to worry parents unduly.
Additionally, since children’s scores at Key Stage 1 were reported as either N, 1, 2 or 3, and level 2 was seen as the expected level, the majority of children were seen as having reached an expected level. Under the new system, however, many parents will be concerned (and possibly anxious) about their seven year olds’ attainment. Since the 'expected standard' is now set as an ‘average’ mark rather than an ‘average’ band, lots more children will appear to be ‘failing’.
The good news is that parents really should not worry too much about the scores which their children are given. Broadly, the following is a good rule of thumb for the new Scaled Scores:
Scaled Scored above 107: Above the expected level for their age.
Scaled Scored between 93 and 107: At the expected level for their age.
Scaled Scored below 93 (or N): Below the expected level for their age.
Of course, we would all like our children to be above average. But as most of us recognise, that is simply not possible, and roughly half of all children under this new system will be seen to be ‘worse than average’.
Scaled scores are fuzzy
All those who try to interpret test scores of any kind should bear in mind that any measurement of knowledge and educational attainment is extremely fuzzy. Most of us know this instinctively, and this is why in this country, even at the highest level, we award test takers grades and not raw scores. Undergraduates get 2.1s, not ‘105’, A level students get A*s, not ‘115’s.
For a number of reasons, the DfE (and many others) like to pretend that tests are much more accurate than they really are, and insist on using numbers when intervals make much more sense. Even the old level system, which placed Year 2 children into one of four grades, actually represented a range of achievement which couldn’t be summarised by a single number.
So a child who has been awarded 97 points (18/40), for example, may have had a brilliant day and would, if repeatedly tested, actually score something closer to 93 points (12/40). The same child may have had an awful day, as many 7 year olds do, and repeated testing would reveal a score of 102 (26/40). This level of measurement error can be modelled mathematically using confidence intervals, but - as happens frequently with numbers in education - it often isn’t, and that isn’t done here.
A further complication when testing 7 year olds is the age spread of the children. I’ve written extensively about this. In summary, some children taking the tests in May 2016 were almost a year older than their classmates, a huge difference at this age. The older children can be reasonably expected to get higher scores, moving the mean and pushing down the already lower scores of a typical summer-born young Year 2 child.
A further problem with any number attached to attainment is that parents and children might succumb to either complacency or frustration. Those whose children get higher scores (especially those who are older, or particularly well supported outside of school) might ease off their focus on developing their growing knowledge and understanding at a fast pace. Those who get lower scores (particularly if they are young, or find school particularly difficult) might give up, and decide that they are no good at learning. Placing (fuzzy and fundamentally inaccurate) numbers on knowledge when there are so many negative repercussions is simply a bad idea.
What parents and schools should really be interested in is the range of scaled scores achieved by a class. Parents are unlikely to find this out, however, as it would identify certain children – since virtually no parent in the country doesn’t know the names of the top and bottom child in their own child’s Year 2 class. Schools can make use of this information – the fact that some children got above 110 and some below 90 indicates, as should be obvious to anyone in education – that children’s results are primarily driven by the child and not their teacher.***
Scaled scores are political
Putting numbers on learning puts pressure on schools and unsettles parents. Simply by reducing learning to numbers, a scale is formed and that scale has ‘winners’ and ‘losers’. Schools are put under pressure to ensure that their tests results are as high as can be. Parents are unsettled and put pressure on schools. All in all, numbers in education increase anxiety within the educational system.
This is a political choice. It would be entirely feasible to remove high stakes testing and labelling of children from the primary school system, and to only require children to sit external tests when those tests lead to meaningful outcomes for the children. This was the case until just 20 years ago, until data on children in Year 2 began to be collected by central government.
The decision to move from a 20-year-old system (which labelled 80% of children as working at or above the expected level for their age), to this new one (which labels 50% of children as ‘failing’) is a political decision. Under any system with numbers, politicians can always suggest that schools and those who work in them are ‘failing’ some children; those in Westminster have, after all, a vested interest in continuing to claim that things could be better than they currently are.
Many people, particularly politicians looking to impress on the electorate their ‘high expectations’, ‘higher standards’ and so on, feel that – whilst it has side effects - putting pressure on schools is A Good Thing. Without the supposed objectivity provided by numbers, they argue, we would simply have to trust schools and those who work in them, which governments have encouraged parents not to do, even though most parents continue to trust the schools which help to educate their children. Without numbers to pin on children, their teachers and their schools, the argument goes, how would we know whether they were doing the best for the community they serve?
Many others are concerned about the effect that labelling learning has on children’s experience of education. They worry that the pressure on schools means that curricula are narrowed to only those aspects of learning which are measured by tests, and they worry that those children who find school hard compared to their peers don’t excel in a system which labels them as failing at an early age. They worry that the constant criticism of teachers and teaching, and the ever-increasing pressure which this causes, is driving people from the profession and changing what is expected in and from schools.
In the meantime, parents are having to come to terms with a new system at key Stage 1 which is confusing, alarming, fuzzy and political. The new system systematically ensures that more children are labelled as failing than were previously. Schools will come under yet more pressure due to the changes which have been made.
Should parents be unduly worried? In the vast majority of cases, probably not. Young children are still going to primary school, still learning to read, write and use numbers, and – often despite the distorting effect of political meddling – learning plenty more besides. A few numbers can’t sum up a small child, and wise parents will trust their own child, and their child’s school. If you have any concerns about the new Scaled Scores and what they mean, speak to your child’s teacher. They know your child, and when it comes to their education, they are the ones who should be able to answer your questions. As with many aspects of modern life, when the numbers are baffling, it’s often best to seek reassurance from those who know what's really going on.
* The DfE went further, converting raw scores into ‘fine levels’, which essentially placed children on a linear scale which began somewhat arbitrarily at 9 points and rose to 21 points in Key Stage 1. There were then used for further analysis which was used to hold schools to account for their children’s results and progress.
** As far as I can tell, anyway - it isn't clear what the DfE has based the conversion of raw scores to scaled scores on, but this seems to be the most logical way to have done it.
*** Averages and thresholds tell you virtually nothing about the teaching, and a great deal about the cohort; a message which is taking rather a long time to sink in at the DfE and elsewhere.
 RSS Feed
