Schools are held ransom by dubious analysis of test score data. And the fine detail of the data is, it appears, dangerously wrong, and wilfully misleading. It’s also incredibly hard to scrutinise independently. Test marks are, it transpires, used to create spurious ‘Fine Grades’ which are used as if they were measured, scalable numbers. If more head teachers knew how much every SATs test answer mattered, many more would question the results they are allocated.
I’ve mentioned Fine Grades before, here and here. A Fine Grade is a single number, which is used in complex-but-daft analysis in RAISEonline and FFT estimates. I wondered out loud last year about the methodology for calculating ‘Fine Grades’, but I couldn’t find an explanation anywhere online. I have now found one, buried within an Appendix to a consultation document issued just before Christmas. And I simply can’t quite believe what I’ve found.
But first, there are two important aspects of educational measurement which need to be revisited. The first is that grades are guesswork, and we need to be careful when we use them to summarise a child’s current ability. They may be – excuse the woeful pun – educated guesses, but they are guesses nonetheless. I’ve written about this before, but here are the edited highlights:
Tests are designed to sample knowledge, skills and understanding to provide an estimate of the full range of knowledge, skills and understanding (the ‘domain’) a child might possibly have.
Daniel Koretz’s Measuring Up, published in 2008, summarises this point:
‘The results of an achievement test – the behaviour of students in answering a small sample of questions – is used to estimate how students would perform across the entire domain if we were able to measure it directly.’ (p20)
“There are three distinct reasons why scores on one test, taken by themselves, are not enough to tell which schools are good or bad. The first is that even a very good achievement test is necessarily incomplete and will leave many aspects of school quality unmeasured.
The second reason not to assume that higher scores necessarily identify better schools is that, in the current climate, there can be very large differences among schools in the amount of score inflation.
The third and perhaps most important reason scores cannot tell you whether a school is bad or good is that schools are not the only influence on test scores. Other factors, such as the educational attainment and educational goals of parents, have a great impact on students’ performance.” (P325-6)
In summary, the test score in a single test is not a reliable ‘measure’ in the conventional sense. This is why we report Levels and Grades to children and parents in our education system. We rank children into a limited number of ‘big buckets’, which are generally fuzzy, unreliable and often wrong. Grades are, to a large extent, guesswork, since we can only go on what we can get children to demonstrate in written tests.
The second point is that the total number of marks a child is awarded on any given externally-marked test can mean many different things. One child’s 14/20 is likely to be different to another child’s 14/20. This blog, by Tom Sherrington, gives a good insight into this. Often, externally marked exams are subject to administrative error or idiosyncratic interpretation of mark schemes. Many schools are fully aware of this, and often ask for papers to be remarked. Most marks change when this happens
This recent blog demonstrates the extent of the problem, as the school, disappointed with their GCSE English Literature results, ‘sent back a sample for remarks, when they were upgraded that triggered a full cohort, all 198, remark. Of the 198 papers no less than 97 were awarded an extra grade and a few two grades higher. Instead of 85% A*-C it is now 95% A*-C and 44% A*A rather than 28% A*A.’
Ofqual, the government’s qualification watchdog, publishes details of requests for remarks of GCSE and A Level papers (which it refers to as ‘enquires’). In 2014, there was a huge increase from 304,400 to 451,000 papers which were asked to be remarked. This resulted in 77,400 grades being changed, and whilst it is not clear how many marks changed, it is fair to assume that it was somewhat higher than this number.
Whilst this represents less than one percent of all GCSE and A Level papers which were graded in 2014, it is quite remarkable how many of the papers changed grade: 17%, or one in six papers. Whilst this is a selective sample of the whole population which sat the exams – after all, only those who were close to the grade boundary will have asked for their papers to be remarked – the blog above suggests that some schools which have requested a complete remarking of all their papers have found that around half of their students increase their grade.
And these are high stakes examination, which matter a great deal for children. Key Stage 2 results only matter to schools: They mean little or nothing to children. But the number of inaccurately reported marks in KS2 test is likely to be as high as it is in GCSE.
All of this casts serious doubt on the reported total number of marks a child has been given, and it’s clear that we use grades because ‘total marks awarded’ is not a particularly good estimation of a child’s current ability.
So, bearing in mind these two serious issues, here’s how ‘Fine Grades’ are calculated
This is taken from a Statistical Working Paper entitled ‘Measuring disadvantaged pupils attainment gaps over time’ issued in December 2014:
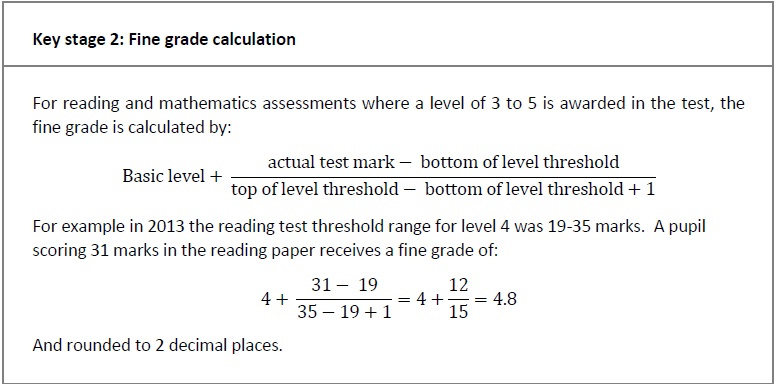
Yes, it’s got equations and everything, but it’s fairly straightforward, honest. It has a few interesting points, one of which being the ‘but why add 1’ in the lower equation. There is also a glaring mistake in the lower equation which would be a howler in a student’s work. I’ll leave you to ponder that whilst I explain the rest. Apologies if this is patronising, but experience suggests that anything involving numbers in education needs careful explanation.
So, this is a way of working out what ‘Fine Grade’ a child will be awarded in Year 6. Children sit papers which have marks. The marks are grouped into ‘threshold ranges’ so that parents can be told in which big bucket their child is currently working: ‘Level 3’, ‘Level 4’ or ‘Level 5’. Level 2 and Level 6 are ‘yes/no’ levels, and calculated differently. (Levels have been abolished, of course, except that they haven’t quite died yet and are still being used in 2014/15; next year the situation is likely to be even worse, but I’ll worry about that then.)
Clearly, this means that children can be only put into three ‘buckets’ (as per point one above). It is obviously difficult to do much in the way of analysis with results with only three categories, so ‘Fine Grades’ invent more categories which look like – but, crucially, are not – countable numbers. Levels are categories too, not countable numbers, even though they are cunningly designed to look them. Remember that there is no Unit of Education, so the progress between level 3 and level 4 has no linear equivalence to the progress between level 4 and level 5.
So, a Fine Grade takes the ‘bucket’ a child is placed in – 3, 4 or 5 – and then adds a bit. A bit of what, you might ask? Well, a bit of ‘rank’, I suppose. It’s done like this:
Take a child’s (almost certainly inaccurate) total marks. Divide this by the range of possible marks in a ‘bucket’. Turn this into a number, to two decimal places. Or possibly one. It isn’t clear. I’ve never seen a list of Fine Grades, since I’m simply a teacher and this witchcraft isn’t normally explained to us. I don’t think anyone in a primary school has ever seen a fine grade either – I think that the data isn’t available before Year 11 - but if you have, do let me know.
The example here (12 / 15) gives an answer which is 0.80, conventionally written as 0.8. 11/15 would give 0.73 to two decimal places, 0.7 to one, but the badly chosen example isn’t very clear. If it is to two decimal places, then the ‘Level 3 bucket’ has magically been expanded to 16 separate buckets, all of which look like scaled numbers, but which aren’t.
They would look like this: 0.07, 0.13, 0.2, 0.27, 0.33, 0.4, 0.47, 0.53, 0.6, 0.67, 0.73, 0.80, 0.87, 0.93, 1.00 and 1.07. And to be clear, these are categories, not continuous numbers. There is no 0.08, for example.
So, have you spotted ‘the why add one’ and the glaring howler yet? Here they are.
Why add one? Adding one solves a simple problem, which is that the top mark in a level threshold (top of level threshold– bottom of level threshold)/ (top of level threshold – bottom of level threshold) = 1. To avoid this, simply add 1 to the denominator. Now a student awarded top marks in Level 4 can’t have a Fine Grade of 4+1.
The glaring howler? 35-19+1 is 17, not 15, as per the example. The example should say 4+12/17, which is 0.71 (to 2 decimal places). I assume that this is a mistake in the paper I found, and isn’t repeated throughout RAISEonline and FFT ‘analysis’.
I did find this, however, which makes me wonder. It’s from a paper called ‘FFT: KS2 2012: Calculating Fine Grades’, and it gets its maths wrong too.
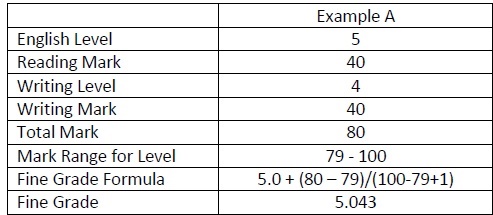
5+(80-79)/(100-79+1) = 5.045, not 5.043. Adding 2 to the denominator gets 5.043. Which is somewhat worrying. What other errors are lurking in the analysis of school’s test results?
All of this says to me that those who have developed the ludicrous methodology behind RAISEonline and FFT analysis really do need to be ashamed of themselves. Getting basic maths wrong is probably forgivable. We all make mistakes. But someone should have checked the maths – it shouldn’t be up to teachers like me to find these elementary errors.
But beyond the basic inaccuracies, someone somewhere should have had an overview which sat between those who have developed tests, and those who have created statistical tools which turn fairly randomly distributed mark totals into Cargo Cult Data.
I am willing to bet that virtually no school realises that its RAISEonline Value Added scores – and those little blue and green indicators in RAISE reports – are based on the actual total number of marks obtained in tests, rather than simply on grade ‘bucket’ awarded to each child. No wonder that those that do teach so carefully to the test.
We know that remarked test papers are given higher mark totals. If I were a head teacher, I would be sorely tempted to have every set of externally marked papers returned and remarked. It is highly likely that the number of marks on each test is, on the evidence, likely to increase. And in a culture of high stakes testing, who could blame a school for doing just that?
And finally, it has taken me a long time to find this information. It isn’t readily available. It should not be up to people like me to scrutinise basic maths and criticise dubious statistical analysis. Surely education unions or data consultancies - or even Ofsted - should be looking more closely at the way that test results are being used in the increasingly data-driven world of education? Fine Grades are dangerously wrong, and wilfully misleading. They have no place in holding schools to account.
 RSS Feed
