(This is one of a pair of a posts about teachers' Performance Related Pay. The other relates the history and implications of the policy: Problematic Performance Related Pay)
Performance Related Pay in education has frequently been linked to narrow measures of pupil performance rather that of teachers. Many refer to levels of 'expected progress' which can't be applied to individual children, or to class-sized groups of children. Many teachers, however, have PRP targets which are framed in this way. Since individuals and their classmates can, quite reasonably, be expected to perform very differently to the mean of a national population, statistics for mean outcome of population groups tell us very little about expected outcomes for individual pupils.
Pupil progress varies considerably from child to child
This graph from FFT Datalab shows how variable measured pupil progress actually is:
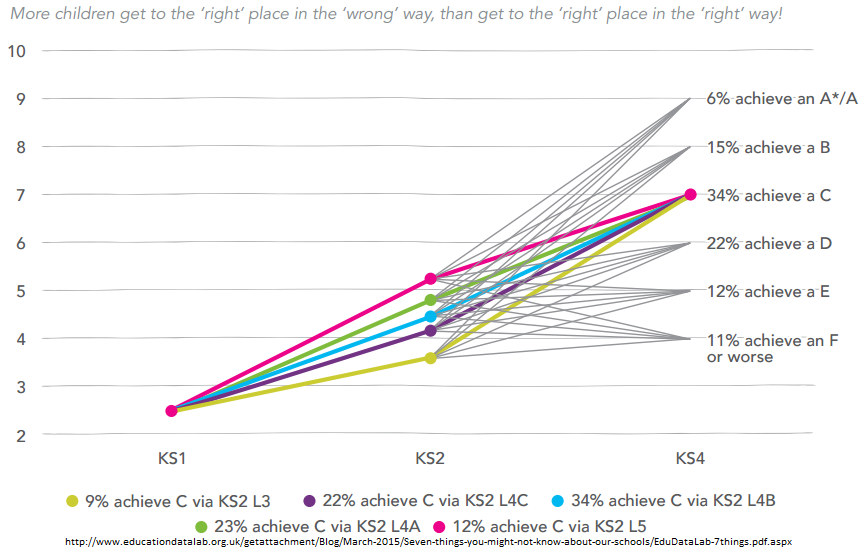
This shows that, of those children assessed as being at Level 2b at the end of KS1, a number were assessed at Level 3 at the end of KS2. Of these children, some went on to be awarded anything from A*/A to F or lower. Progress is not linear, and children develop at different rates.
RaiseOnline’s library contains graphs which it calls ‘transition matrices’ which show the variability of progress from one key Stage to the next. This is a typical example:
RaiseOnline’s library contains graphs which it calls ‘transition matrices’ which show the variability of progress from one key Stage to the next. This is a typical example:
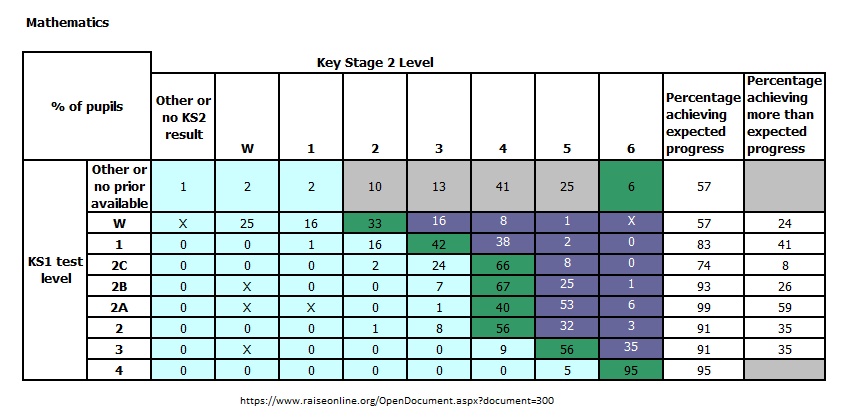
This shows that in Maths, a child awarded a 2C at KS1 could potentially have been awarded level 2, 3, 4, or 5. Nationally, most children were assessed at Level 4 (66%) in KS2, of course, but 24% were assessed at Level 3, and 8% were judged to have reached Level 5. One in ten of those assessed at Level 3 did not attain level 5.These are national figures and there are around 500,000 children in each year group. A substantial number of children did not make two levels of progress; it is highly likely that they are not distributed evenly across the school network.
Now, it might be possible to argue that these figures show the impact of differing levels of ‘teacher quality’. The main problem with this argument is that it simply isn’t borne out over time, since the figures are largely similar – at national level - from year to year. The data cannot, therefore, be said to capture any impact of teachers on results for a number of fairly obvious reasons (the way grade boundaries are set and the nature of summative testing in the school system being the most obvious).
The other important observation which can be made using the RaiseOnline transition matrices is that children’s progress is clearly a function of their prior attainment. Of those assessed at lower than level 2B at the end of KS1, the likelihood that a random child will have made ‘expected progress’ (2 Levels) is considerably lower than for a random child assessed at 2b and above. (Level 1 is of course an anomaly because it isn’t split into three sub-Levels).
Therefore, a class with more children whose prior attainment was low will struggle, on average, to make ‘expected progress’ when compared to more able cohorts. Those with more able cohorts might also find, for a variety of reasons, that a number of their children will not have made two levels of progress either.
So where does that leave you?
If your class performed well in their end of year tests, this issue is unlikely to concern you. If, however, you have a PRP target which is based on pupil outcomes, and your children have not hit their targets, you might want to look closely at the FFT and Raise documents referred to above. I’ll conclude by saying that numbers in education are fuzzy, and badly measured at best. Levels have been discontinued for any number of reasons, and it is generally agreed that they were, at best, an inadequate measure of children’s progress. Progress isn’t linear, and individual children can’t be expected to follow national trends. Expected progress simply does not apply at individual or class level and should not determine whether or not you are doing your job well.


 RSS Feed
