Cargo Cult Science is the term popularised by Richard Feynman in his 1985 book ‘Surely You're Joking, Mr. Feynman!’, referring to activity which has the trappings of real science, but which lacks the rigour which we might reasonably expect of real science. Tom Bennett, in his book 'Teacher Proof', gives a set of signs to look for ‘Cargo Cult’ research. Tom’s list of klaxons include: Research carried out by interested parties, small sample sizes, a lack of a control group, the absence of double-blind testing, confirmation bias, illusory correlation, mistaking cause and effect, the Hawthorne effect and the appeal to novelty.
Much of the progress-tracking ‘data’ which has become all too important in English education could actually be more correctly described as Cargo Cult Data. Cargo Cult Data has the appearance of real data, without having any of the requirements of statistically valid actual data from which one could reasonably draw inferences. It doesn’t pass the simple Fair Test most primary school children would recognise, much less the expectations of those who wish to Teacher Proof the data they are working with.
Michael Tidd has made the clear case that tracking is not the same as assessment, a point which is often lost in schools. As Michael notes, “Inevitably, the way that Ofsted works has meant that schools have been forced to use their assessments in the form of National Curriculum levels to demonstrate that they are tracking progress towards the end-of-key-stage expectations. However, in doing so we have all but divorced the act of assessment from the processes of teaching and learning.”
All teachers assess, all the time. We all have a good idea which of the children we teach are thinking hard, making progress, struggling with the demands of school, not in a position to learn or actively disrupting the learning of others, and so on. Assessment is an instinctive thing to do if you are trying to help children to learn.
Most data used to track progress, however, is simply guesswork, and often fairly random guesswork at that since, as Daniel Willingham is fond of saying, we can’t get into children’s heads to find out what they are learning or have learnt. We can ask children to write things down, but this isn’t the same as tracking their progress. It is pretty much the source of all progress-tracking data, however.
Where the progress-tracking data originates from high stakes written tests, at best it indicates how well children can answer (or be taught to answer) a written test. Where the progress-tracking data originates from what has become know as ‘teacher assessment’, it is hugely compromised by what Owen Elton refers to as the Teacher’s Dilemma, the effects of targets and many other distortions. The end result is that much of the progress-tracking ‘data’ used to assess learning, schools and teachers is simply ‘Cargo Cult Data’ – it looks like it can be used in the way statisticians use data, but its inherent flaws mean that this simply isn’t the case.
How did we end up in this mess?
Whilst many teachers will know the history of progress-tracking data, many of those not working in schools might not know how we came to be where we are. It’s worth looking at a bit of background.
Up to the mid-1980s, English schools worked in splendid isolation, for the most part. Teachers taught, children learned, but no one really had any overview of what teachers were teaching or children were learning in different schools below the age of 16, and there was no data which could be used to compare schools. That all changed when SATs were introduced, examination results began to be published, and the National Curriculum introduced ‘levels’ in the early 1990s. At that point schools began to develop progress-tracking Cargo Cult Data, taking guesses about the ‘level’ a child might be working at any given point in their education.
Levels were first used as indicators, and if that was all they were being used for, there would be some argument for them being useful. After all, it is helpful to have some information on where children are and where they need to go next. Many argue that teachers have always done this, and were doing it before the National Curriculum levels were introduced. Having a rough linear(ish) plan of development across the curriculum clearly makes sense. What doesn’t make sense is what happened next.
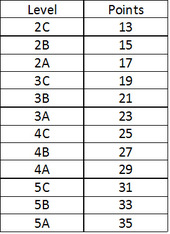
Within schools, teachers began to balk at the assumptions which were being made about the Cargo Cult Data which was rapidly being generated from the broad stages of development which the NC levels outlined. A figure of two levels of progress across a key stage was plucked from the air. The levels, which were already very broad, very subjective descriptions of learning, were subdivided into three sublevels.
In Primary Schools, with 4 years in Key Stage 2, this soon transmogrified into an expectation that a child would make two sub-levels of progress each year to be deemed to be make ‘good progress.’ Sublevels had numbers attached to them, which were labelled ‘point scores’. These point scores look, to those who simply don't understand the assumptions underlying actual data, misleadingly like something which has been measured, rather than simply guessed.
Much of the progress-tracking ‘data’ which has become all too important in English education could actually be more correctly described as Cargo Cult Data. Cargo Cult Data has the appearance of real data, without having any of the requirements of statistically valid actual data from which one could reasonably draw inferences. It doesn’t pass the simple Fair Test most primary school children would recognise, much less the expectations of those who wish to Teacher Proof the data they are working with.
Michael Tidd has made the clear case that tracking is not the same as assessment, a point which is often lost in schools. As Michael notes, “Inevitably, the way that Ofsted works has meant that schools have been forced to use their assessments in the form of National Curriculum levels to demonstrate that they are tracking progress towards the end-of-key-stage expectations. However, in doing so we have all but divorced the act of assessment from the processes of teaching and learning.”
All teachers assess, all the time. We all have a good idea which of the children we teach are thinking hard, making progress, struggling with the demands of school, not in a position to learn or actively disrupting the learning of others, and so on. Assessment is an instinctive thing to do if you are trying to help children to learn.
Most data used to track progress, however, is simply guesswork, and often fairly random guesswork at that since, as Daniel Willingham is fond of saying, we can’t get into children’s heads to find out what they are learning or have learnt. We can ask children to write things down, but this isn’t the same as tracking their progress. It is pretty much the source of all progress-tracking data, however.
Where the progress-tracking data originates from high stakes written tests, at best it indicates how well children can answer (or be taught to answer) a written test. Where the progress-tracking data originates from what has become know as ‘teacher assessment’, it is hugely compromised by what Owen Elton refers to as the Teacher’s Dilemma, the effects of targets and many other distortions. The end result is that much of the progress-tracking ‘data’ used to assess learning, schools and teachers is simply ‘Cargo Cult Data’ – it looks like it can be used in the way statisticians use data, but its inherent flaws mean that this simply isn’t the case.
How did we end up in this mess?
Whilst many teachers will know the history of progress-tracking data, many of those not working in schools might not know how we came to be where we are. It’s worth looking at a bit of background.
Up to the mid-1980s, English schools worked in splendid isolation, for the most part. Teachers taught, children learned, but no one really had any overview of what teachers were teaching or children were learning in different schools below the age of 16, and there was no data which could be used to compare schools. That all changed when SATs were introduced, examination results began to be published, and the National Curriculum introduced ‘levels’ in the early 1990s. At that point schools began to develop progress-tracking Cargo Cult Data, taking guesses about the ‘level’ a child might be working at any given point in their education.
Levels were first used as indicators, and if that was all they were being used for, there would be some argument for them being useful. After all, it is helpful to have some information on where children are and where they need to go next. Many argue that teachers have always done this, and were doing it before the National Curriculum levels were introduced. Having a rough linear(ish) plan of development across the curriculum clearly makes sense. What doesn’t make sense is what happened next.
Within schools, teachers began to balk at the assumptions which were being made about the Cargo Cult Data which was rapidly being generated from the broad stages of development which the NC levels outlined. A figure of two levels of progress across a key stage was plucked from the air. The levels, which were already very broad, very subjective descriptions of learning, were subdivided into three sublevels.
In Primary Schools, with 4 years in Key Stage 2, this soon transmogrified into an expectation that a child would make two sub-levels of progress each year to be deemed to be make ‘good progress.’ Sublevels had numbers attached to them, which were labelled ‘point scores’. These point scores look, to those who simply don't understand the assumptions underlying actual data, misleadingly like something which has been measured, rather than simply guessed.
The point scores had become measures, at which point the true progress-tracking Cargo Cult Data was born. Driven by companies such as RM plc, the numbered point scores were treated if they were accurate measurements, which could then be subjected to statistical analysis. RM’s targeting offshoot, the FFT, then extrapolated this Cargo Cult Data into ‘estimates’ of future progress, in a way of which the financial services industry would be ashamed – past performance being no indication of future performance, as we all now surely know.
The attempt to find out how children were progressing in school spiralled downward into an unholy mess which ended up eating itself – or did it?
Enter politicians and their well thought out ideas
In a bizarre final twist, we are now on the threshold of a brave new world, since the current government have officially abolished levels. What’s that, I hear you ask? They’ve been abolished? Really? How did that happen? Well, with all of the criticism of the levels system, it was fairly obvious to all concerned that whatever levels were supposed to do, they weren’t very good at it. So they’ve gone.
Except they haven’t. Kevin Bartle wrote an excellent article about this this time last year (Spirit Levels: Exorcising The Ghost of Assessment Past), and Joe Kirby followed it up last November with thoughts on Life after Levels.
Liz Truss, Minister for Schools, speaking in April 2014, said that, "The old system for tracking a child’s progress was called ‘levels’. Levels became an end in themselves. So in 2012, we decided to scrap levels." And in one bound we were all free, to do what we want, any old time.
The Dead Levels message hasn’t got through to many schools, however. My school, for example, has a numeracy policy entirely based on levels, and children’s literacy work continues to be graded into sublevels each half term. The school I left in December had levels embedded deeply within all its progress-tracking. When OFSTED judged my school last year, they did so entirely based on progress-tracking Cargo Cult Data based on levels – Achievement of Pupils (based on levels) lead to a Quality of Teaching grade which lead to Overall Effectiveness grade, as it does in (bar one or two exceptions) every OFSTED report.
So what do we do now?
Liz Truss still seems to think that progress-tracking Cargo Cult Data can be used effectively in the brave new No-Level world. Here she is again in that speech in April, “Children will get a score. If they get 100, they’ve hit the expectations for their age. Above that score - and they’re ahead. Below, and they’re behind. It’s consistent across year groups. This is how the new end of key stage 2 tests will work - and schools can decide whether to have similar tests for the other years.”
So at 11 years of age (or significantly younger in some children's cases), children's knowledge will be guessed at and given a number on a scale. As to what schools do to show the progress demanded of by government accountability system 'for the other years', well, who knows. The government, based on Liz Truss's remarks above, clearly has no idea. Conferences are being held, and schools are trying to figure out what to do.
My strong advice is that we ditch anything which is Cargo Cult Data and only allow actual data to be used to track progress. I know. I can but hope, and keep chipping way at the flawed foundations of the Data Disaster.
What actual data can we collect and analyse?
The truth is, not very much. Knowledge is too complicated to be reduced to numbers, on the whole. Tests assess test-taking, and Cargo Cult Data is likely to rear its ugly head again. That said, some knowledge is fundamental to making progress in education, and that knowledge can be assessed and tracked numerically.
The actual data I collect and analyse is:
This, added to the birthdate information I wrote about in my last article, is just about all I can see can be reasonably described as 'actual data'. I'd be interested to hear what those education think that they collect which isn't Cargo Cult Data. In particular, I'd be interested to hear what data secondary teachers collect. Do secondary maths teachers track times tables and number bond knowledge? Do you track information which is actual data?
I assess number bond and times table knowledge on a weekly basis with all the children I teach. The children take a two minute test, and I record children’s results and progress over time. The process takes around ten minutes a week and it gives me excellent information which I can then use in my teaching.
For the record, I also keep an eye on the following:
This is harder to track in any meaningful 'numerical data' way, but it is core knowledge which I can and do monitor. For some children, I do record this using numbers, particularly when I've spotted gaps and am attempting to fill them.
Beyond this, I record indicators of children’s progress. My guess is that, currently, this is what most teachers actually do, even if the 'data' then ends up being used as Cargo Cult Data by others. I find the National Curriculum levels quite useful as indicators. Yes, using the NC levels is hugely subjective, and subject to all kinds of biases, and I probably under record some children and over record others. Although, as long as no-one tries to subject this information to techniques used to summarise actual data (a forlorn hope in most cases), I have no problem with it, and I find it useful.
I'd be interested to hear what actual data other teachers and schools have found to be useful, and how this data is collected and used. Please comment below or contact me at [email protected].
The attempt to find out how children were progressing in school spiralled downward into an unholy mess which ended up eating itself – or did it?
Enter politicians and their well thought out ideas
In a bizarre final twist, we are now on the threshold of a brave new world, since the current government have officially abolished levels. What’s that, I hear you ask? They’ve been abolished? Really? How did that happen? Well, with all of the criticism of the levels system, it was fairly obvious to all concerned that whatever levels were supposed to do, they weren’t very good at it. So they’ve gone.
Except they haven’t. Kevin Bartle wrote an excellent article about this this time last year (Spirit Levels: Exorcising The Ghost of Assessment Past), and Joe Kirby followed it up last November with thoughts on Life after Levels.
Liz Truss, Minister for Schools, speaking in April 2014, said that, "The old system for tracking a child’s progress was called ‘levels’. Levels became an end in themselves. So in 2012, we decided to scrap levels." And in one bound we were all free, to do what we want, any old time.
The Dead Levels message hasn’t got through to many schools, however. My school, for example, has a numeracy policy entirely based on levels, and children’s literacy work continues to be graded into sublevels each half term. The school I left in December had levels embedded deeply within all its progress-tracking. When OFSTED judged my school last year, they did so entirely based on progress-tracking Cargo Cult Data based on levels – Achievement of Pupils (based on levels) lead to a Quality of Teaching grade which lead to Overall Effectiveness grade, as it does in (bar one or two exceptions) every OFSTED report.
So what do we do now?
Liz Truss still seems to think that progress-tracking Cargo Cult Data can be used effectively in the brave new No-Level world. Here she is again in that speech in April, “Children will get a score. If they get 100, they’ve hit the expectations for their age. Above that score - and they’re ahead. Below, and they’re behind. It’s consistent across year groups. This is how the new end of key stage 2 tests will work - and schools can decide whether to have similar tests for the other years.”
So at 11 years of age (or significantly younger in some children's cases), children's knowledge will be guessed at and given a number on a scale. As to what schools do to show the progress demanded of by government accountability system 'for the other years', well, who knows. The government, based on Liz Truss's remarks above, clearly has no idea. Conferences are being held, and schools are trying to figure out what to do.
My strong advice is that we ditch anything which is Cargo Cult Data and only allow actual data to be used to track progress. I know. I can but hope, and keep chipping way at the flawed foundations of the Data Disaster.
What actual data can we collect and analyse?
The truth is, not very much. Knowledge is too complicated to be reduced to numbers, on the whole. Tests assess test-taking, and Cargo Cult Data is likely to rear its ugly head again. That said, some knowledge is fundamental to making progress in education, and that knowledge can be assessed and tracked numerically.
The actual data I collect and analyse is:
- Number Bond knowledge
- Times Table Knowledge
This, added to the birthdate information I wrote about in my last article, is just about all I can see can be reasonably described as 'actual data'. I'd be interested to hear what those education think that they collect which isn't Cargo Cult Data. In particular, I'd be interested to hear what data secondary teachers collect. Do secondary maths teachers track times tables and number bond knowledge? Do you track information which is actual data?
I assess number bond and times table knowledge on a weekly basis with all the children I teach. The children take a two minute test, and I record children’s results and progress over time. The process takes around ten minutes a week and it gives me excellent information which I can then use in my teaching.
For the record, I also keep an eye on the following:
- Knowledge of the Alphabet
- Knowledge of phonemes and graphemes
- Knowledge of punctuation marks
This is harder to track in any meaningful 'numerical data' way, but it is core knowledge which I can and do monitor. For some children, I do record this using numbers, particularly when I've spotted gaps and am attempting to fill them.
Beyond this, I record indicators of children’s progress. My guess is that, currently, this is what most teachers actually do, even if the 'data' then ends up being used as Cargo Cult Data by others. I find the National Curriculum levels quite useful as indicators. Yes, using the NC levels is hugely subjective, and subject to all kinds of biases, and I probably under record some children and over record others. Although, as long as no-one tries to subject this information to techniques used to summarise actual data (a forlorn hope in most cases), I have no problem with it, and I find it useful.
I'd be interested to hear what actual data other teachers and schools have found to be useful, and how this data is collected and used. Please comment below or contact me at [email protected].
 RSS Feed
