At the ResearchED 2014 conference on 6th September, Sean Harford made the following statement during his session with Mike Cladingbowl and Andrew Old.
“The charge that we are overly data driven () is a really odd one to me, because I can’t work that if you’ve got a system that has 80% of schools being graded ‘Good or better’, how anyone with any mathematical background can say that was overly data driven because you’re going to get over half of schools above an average of whatever score you are looking at and 50% of schools below, if it normalised, so the idea that the inspectors are going there blindly following the data doesn’t seem to fit with that overall picture we have at the moment.” (7:38-8:17)
I want to show that it is entirely reasonable to suggest that Inspectors do follow data; if not blindly, then to an extent which would entirely explain why 80% of schools are judged ‘Good or better’.
Take the suggestion that 80% of schools are graded ‘Good or better’ based purely on the data used to judge them. This can also be stated as ‘20% of schools are graded ‘not Good’ based purely on the data used to judge them’. The hypothesis that, given the methodology used to produce and analyse data, judging around 20% of schools to be ‘not Good’ is entirely reasonable.
What evidence is there which suggests this hypothesis might be reasonable?
If data is used to judge schools, where does the data come from?
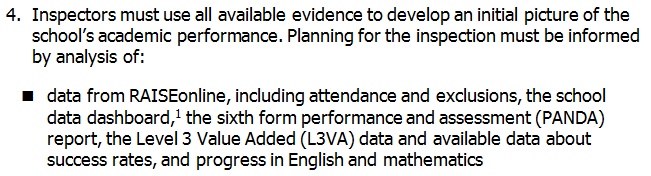
The primary source of data for Inspectors is RAISEonline, as outlined in paragraph 4 of the Schools Inspection Handbook.
“The charge that we are overly data driven () is a really odd one to me, because I can’t work that if you’ve got a system that has 80% of schools being graded ‘Good or better’, how anyone with any mathematical background can say that was overly data driven because you’re going to get over half of schools above an average of whatever score you are looking at and 50% of schools below, if it normalised, so the idea that the inspectors are going there blindly following the data doesn’t seem to fit with that overall picture we have at the moment.” (7:38-8:17)
I want to show that it is entirely reasonable to suggest that Inspectors do follow data; if not blindly, then to an extent which would entirely explain why 80% of schools are judged ‘Good or better’.
Take the suggestion that 80% of schools are graded ‘Good or better’ based purely on the data used to judge them. This can also be stated as ‘20% of schools are graded ‘not Good’ based purely on the data used to judge them’. The hypothesis that, given the methodology used to produce and analyse data, judging around 20% of schools to be ‘not Good’ is entirely reasonable.
What evidence is there which suggests this hypothesis might be reasonable?
If data is used to judge schools, where does the data come from?
The primary source of data for Inspectors is RAISEonline, as outlined in paragraph 4 of the Schools Inspection Handbook.
How does RAISEonline indicate ‘not Good’ results?
RAISEonline doesn’t simply divide schools into ‘above average’ and ‘below average’. If this were the case, Sean would be correct, and this would clearly mean that 50% of schools were ‘good’ and 50% were ‘not Good’. This isn’t what RAISEonline does.
Instead, RAISEonline uses simple comparisons between the test scores allocated to pupils in a given school and the test scores of students nationally, and uses a 95% confidence interval to indicate those results which do not appear to be as a result of chance.
In plain English, the difference between a school’s scores and national scores could be from a wide range of differences. If a score is outside of 95% of expected scores based on the national distribution of scores, it is held to be significant.
An Inspector is directed to consider these significant differences as either ‘Sig+’ (much better than expected) or ‘Sig-‘ (much worse than expected). RAISEonline documentation states that ‘Significance is a statistical term that shows if a difference or relationship exists between populations or samples of data’. This isn’t correct, as I discussed here, but it’s what Inspectors are told.
A ‘Sig-‘ indication therefore leaves the impression that a particular test score is ‘not good’, rather than that ‘it is unusual’.
So could RAISEonline suggest 20% of schools are ‘not Good’?
Given the blunt comparison of school test scores and national test scores, ‘Sig-‘ appears next to ‘a difference between populations (and) samples of data’. So a particular test score – “Key Stage 1 to Key Stage 2 fine grades value added: performance of groups within school - pupil characteristics, Children in receipt of Free School Meals”, to take a typical measure in RAISEonline – could be highly unusual and be indicated as ‘Sig-‘. There could be any number of reasons for this, but the clear impression that it is ‘not Good’.
There are hundreds of numbers in each RAISEonline report which have the potential to be marked as ‘Sig-‘. This increases the number of RAISEonline reports which have a noticeable number of categories marked as ‘Sig-‘, and raises the number of schools which – according to a non-expert reading of RAISEonline – ‘not Good’.
My suggestion is that it is entirely reasonable to suggest that, given the methodology used to produce and analyse data, that around 20% of schools are judged to be ‘not Good’ based on data.
How could you check if this was the case?
RAISEonline reports are not available for analysis by the general public. Ofsted has access to them, however, and could undertake an analysis of school inspection reports and RAISEonline reports to test the hypothesis outlined above. I would expect to find a significant correlation between Achievement of Pupils grades and numbers of ‘Sig-‘ indictors in RAISEonline, which would be entirely consistent with Ofsted’s judgement that 20% of schools to be ‘not Good’.
 RSS Feed
