Percentages are a powerful way to compare samples with different numbers of observations. By standardising measures using a scale of 0 to 100, samples can be compared quickly and easily. Any graph of the data, however, must include the full range of 0 to 100 to ensure that false impressions are not created.
For example, here is a set of data shown with 0-100% on the y-axis:
For example, here is a set of data shown with 0-100% on the y-axis:
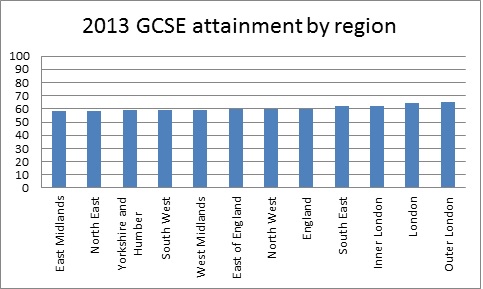
Source: DfE, 2013*
Here’s the same data presented with a limited section of percentages on the y-axis:
Here’s the same data presented with a limited section of percentages on the y-axis:
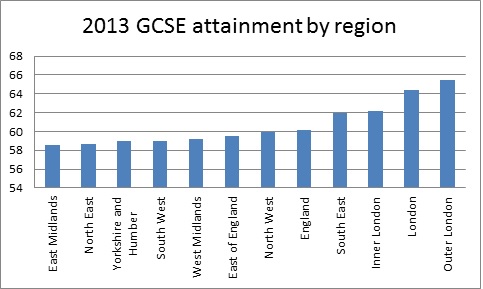
It’s clear that differences which are actually very small are hugely exaggerated by presenting a limited section of the full range of percentages.
*DfE (2013) GCSE and equivalent results including KS3 provisional. [Online]
<https://www.gov.uk/government/publications/2013-gcse-and-equivalent-resultsincluding-
key-stage-3-provisional> [Accessed 28 June 2014]
*DfE (2013) GCSE and equivalent results including KS3 provisional. [Online]
<https://www.gov.uk/government/publications/2013-gcse-and-equivalent-resultsincluding-
key-stage-3-provisional> [Accessed 28 June 2014]


 RSS Feed
