The following is based on data gathered by Michael Tidd, who has asked schools to enter their KS1 scaled scores online to help schools to, as Michael says, 'provide colleagues with some very approximate indicative information about the spread of results in other schools.' As such, everything here must be read with a schooner of salt, as this is by no means a random sample, and is certainly skewed by all kinds of ways, not least by a small sample, various data entry errors and a multitude of other caveats.
That said, this analysis might help schools to understand the wider context of the KS1 scaled scores, and what in might indicate about the scores which have been recorded by the schools in the sample. For an introduction into the 2016 changes to Key Stage 1 SATs, please see my post here.
The first number to report is the mean range of Scaled Scores within each school which has submitted its results. Scores range from 85 to 115, with an 'expected score' of 100. The range of the sample is 27.9 in Reading, 27.9 in SPaG and 28.3 in Maths, each just below the maximum possible value of 30, which indicates that children in nearly all these schools scored both at the very upper end and the very lowest end of the possible scores in the tests. This might give some pause to those who might wish to interpret these scores to suggest that schools have somehow ‘failed’ children, as often happens when results of any kind are published. If nearly every school has children at both ends of the range of measured development, this indicates that the different scores are due to factors primarily located with children, not their teachers, unless every school in the sample has terrible teachers, which I very much doubt.
The stark conclusion which some might reach is that these 2016 KS1 test results suggest that 31.0% of children have ‘failed’ to reach the expected standard in Reading, 39.8% have ‘failed’ to reach the Spelling Grammar and Punctuation (SPaG) expected standard and 39.8%% have ‘failed’ to reach the expected standard in Maths. Given the small sample, this indicates potentially somewhere between 25% and 45% of children have ‘failed’ the tests they were set.
These numbers can be interpreted in a myriad of ways:
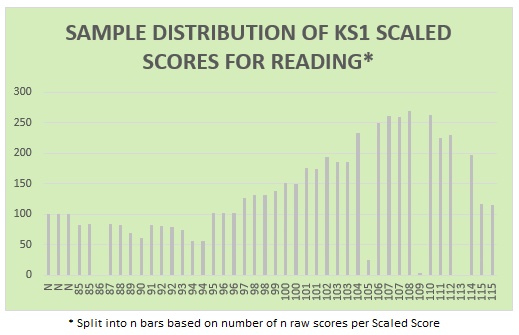
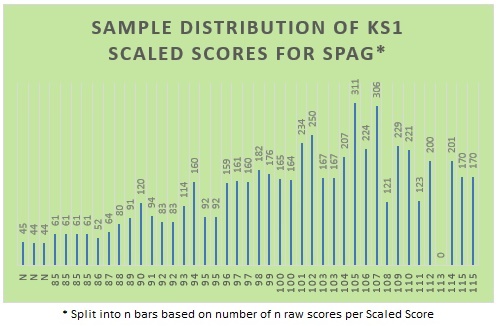
Each of the samples is skewed to the left, with clear ceiling effects (the right hand side of the distribution is curtailed as all those capable of over roughly 90% correct have ended up grouped together, rather than having scores which slowly reduce off to the right). There is an obvious floor effect - the tests were not able to distinguish those achieving at the left hand tail of the distribution. Neither floor nor ceiling effects are unusual in these kind of tests, which use a single written test to approximate all levels of current development
The numeracy test in particular exhibits large ceiling effects, with many students at the higher end grouped getting almost all the available marks.
In summary, children in Key Stage 1 are working at a wide range of developmental stages as assessed by the 2016 standardised tests, with most children working above the expected standard which has been set for them. And finally, please remember that this non-random sample data is extremely fuzzy and should not be over-interpreted.
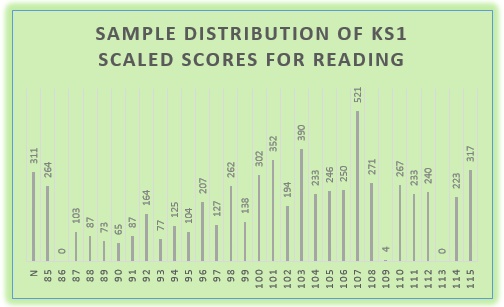
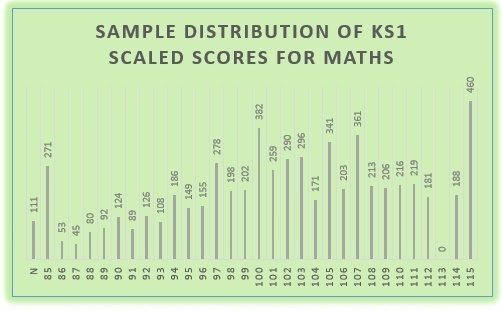
Notes on the tables: The 2016 KS1 scaled scores are awarded based on actual scores as per this document. Some scores are awarded for more than one ‘raw score’ (the actual mark on the test). The first table in each subject below shows the actual Scaled Scores in the sample (and makes it clear that there are some data entry errors – teachers are only human). These tables are quite ‘spiky’ because the bars are not always based on a single raw mark - some are based on two or more raw scores.
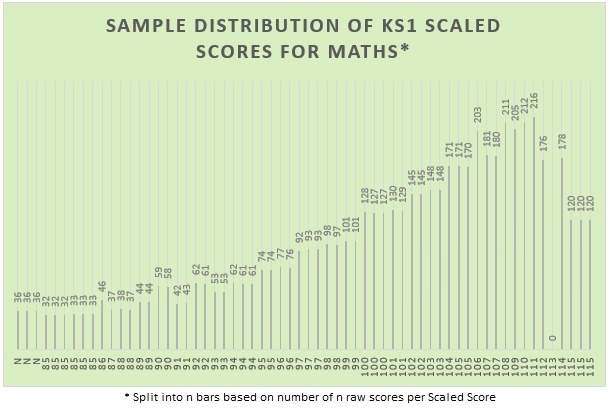
The second table for each subject (marked with an asterisk) has had each Scaled Score awarded to more than one raw mark split as evenly as possible across the two (or more) raw scores. For example, both 24 and 25 marks in the Reading test were awarded a Scaled Score of 101. 351 children in the sample recorded a Score of 101, which has been split into two ‘101’ bars of 176 and 175. This gives a smoother curve on each bar graph, which is likely to be easier to read.
Reading
40 marks available
Mean 101.9, Median 103, Standard deviation 9.4
Scores 1 SD from the mean, 93-111, includes 68.9% of the sample.
69.0% of students reached the ‘expected standard of 100 plus; 31.0% ‘failed’.
That said, this analysis might help schools to understand the wider context of the KS1 scaled scores, and what in might indicate about the scores which have been recorded by the schools in the sample. For an introduction into the 2016 changes to Key Stage 1 SATs, please see my post here.
The first number to report is the mean range of Scaled Scores within each school which has submitted its results. Scores range from 85 to 115, with an 'expected score' of 100. The range of the sample is 27.9 in Reading, 27.9 in SPaG and 28.3 in Maths, each just below the maximum possible value of 30, which indicates that children in nearly all these schools scored both at the very upper end and the very lowest end of the possible scores in the tests. This might give some pause to those who might wish to interpret these scores to suggest that schools have somehow ‘failed’ children, as often happens when results of any kind are published. If nearly every school has children at both ends of the range of measured development, this indicates that the different scores are due to factors primarily located with children, not their teachers, unless every school in the sample has terrible teachers, which I very much doubt.
The stark conclusion which some might reach is that these 2016 KS1 test results suggest that 31.0% of children have ‘failed’ to reach the expected standard in Reading, 39.8% have ‘failed’ to reach the Spelling Grammar and Punctuation (SPaG) expected standard and 39.8%% have ‘failed’ to reach the expected standard in Maths. Given the small sample, this indicates potentially somewhere between 25% and 45% of children have ‘failed’ the tests they were set.
These numbers can be interpreted in a myriad of ways:
- The expected standard in Reading is out of kilter compared to the expected standard in SpaG and Maths.
- Standards have been set at a level which is too high for between 8 to 14 children in a typical KS1 class.
- Most children have risen to the ‘higher expected challenge’ of the new KS1 curriculum.
- Whatever pet theory you care to develop.
Each of the samples is skewed to the left, with clear ceiling effects (the right hand side of the distribution is curtailed as all those capable of over roughly 90% correct have ended up grouped together, rather than having scores which slowly reduce off to the right). There is an obvious floor effect - the tests were not able to distinguish those achieving at the left hand tail of the distribution. Neither floor nor ceiling effects are unusual in these kind of tests, which use a single written test to approximate all levels of current development
The numeracy test in particular exhibits large ceiling effects, with many students at the higher end grouped getting almost all the available marks.
In summary, children in Key Stage 1 are working at a wide range of developmental stages as assessed by the 2016 standardised tests, with most children working above the expected standard which has been set for them. And finally, please remember that this non-random sample data is extremely fuzzy and should not be over-interpreted.
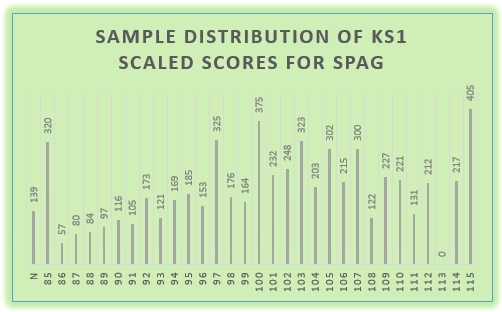
Notes on the tables: The 2016 KS1 scaled scores are awarded based on actual scores as per this document. Some scores are awarded for more than one ‘raw score’ (the actual mark on the test). The first table in each subject below shows the actual Scaled Scores in the sample (and makes it clear that there are some data entry errors – teachers are only human). These tables are quite ‘spiky’ because the bars are not always based on a single raw mark - some are based on two or more raw scores.
The second table for each subject (marked with an asterisk) has had each Scaled Score awarded to more than one raw mark split as evenly as possible across the two (or more) raw scores. For example, both 24 and 25 marks in the Reading test were awarded a Scaled Score of 101. 351 children in the sample recorded a Score of 101, which has been split into two ‘101’ bars of 176 and 175. This gives a smoother curve on each bar graph, which is likely to be easier to read.
Reading
40 marks available
Mean 101.9, Median 103, Standard deviation 9.4
Scores 1 SD from the mean, 93-111, includes 68.9% of the sample.
69.0% of students reached the ‘expected standard of 100 plus; 31.0% ‘failed’.
Spelling, Grammar and Punctuation (SPaG)
40 marks available.
Mean 100.7, Median 102, Standard deviation 9.8
Scores 1 SD from the mean, 91-112, includes 78.2% of the sample.
60.2% of students reached the ‘expected standard of 100 plus; 39.8% ‘failed’.
40 marks available.
Mean 100.7, Median 102, Standard deviation 9.8
Scores 1 SD from the mean, 91-112, includes 78.2% of the sample.
60.2% of students reached the ‘expected standard of 100 plus; 39.8% ‘failed’.
Maths
60 marks available.
Mean 101.6, Median 102, Standard deviation 15.0
Scores 1 SD from the mean, 87-115, includes 94.2% of the sample.
60.2% of students reached the ‘expected standard of 100 plus; 39.8% ‘failed’.
60 marks available.
Mean 101.6, Median 102, Standard deviation 15.0
Scores 1 SD from the mean, 87-115, includes 94.2% of the sample.
60.2% of students reached the ‘expected standard of 100 plus; 39.8% ‘failed’.
Thanks once again to Michael Tidd and all the anonymous schools for collecting the data which has made this analysis possible.
 RSS Feed
